Education
How to Read an Amazon Price Chart
Learn to read an Amazon price history in under a minute: the usual price, the low, the seasonal dips, and the list price you should ignore.
Truffl Editorial · 3 min read · updated Jul 25, 2026

An Amazon price chart is the one thing on the page that tells you whether a price is actually good. The star rating won't. The bold "% off" won't. The trailing price history will — it shows what a product usually costs, how low it actually goes, and whether right now is one of those lows. Here's how to read one in under a minute: four things to look for, on a real example.
Key takeaways
- Read four things: the usual price, the low, the pattern (when it drops), and the list price — which you ignore.
- The Shark FlexStyle usually costs about $285, falls to $199 during sale events, and lists at $349.99 — a number to ignore.
- Today's $289.99 is ordinary — right at its usual price and $90 above its sale low. Not a good time.
- The one question: where does today's price sit between the low and the usual? Near the low → buy. At or above the usual → wait.

It's at or below its usual price right now — a good moment.
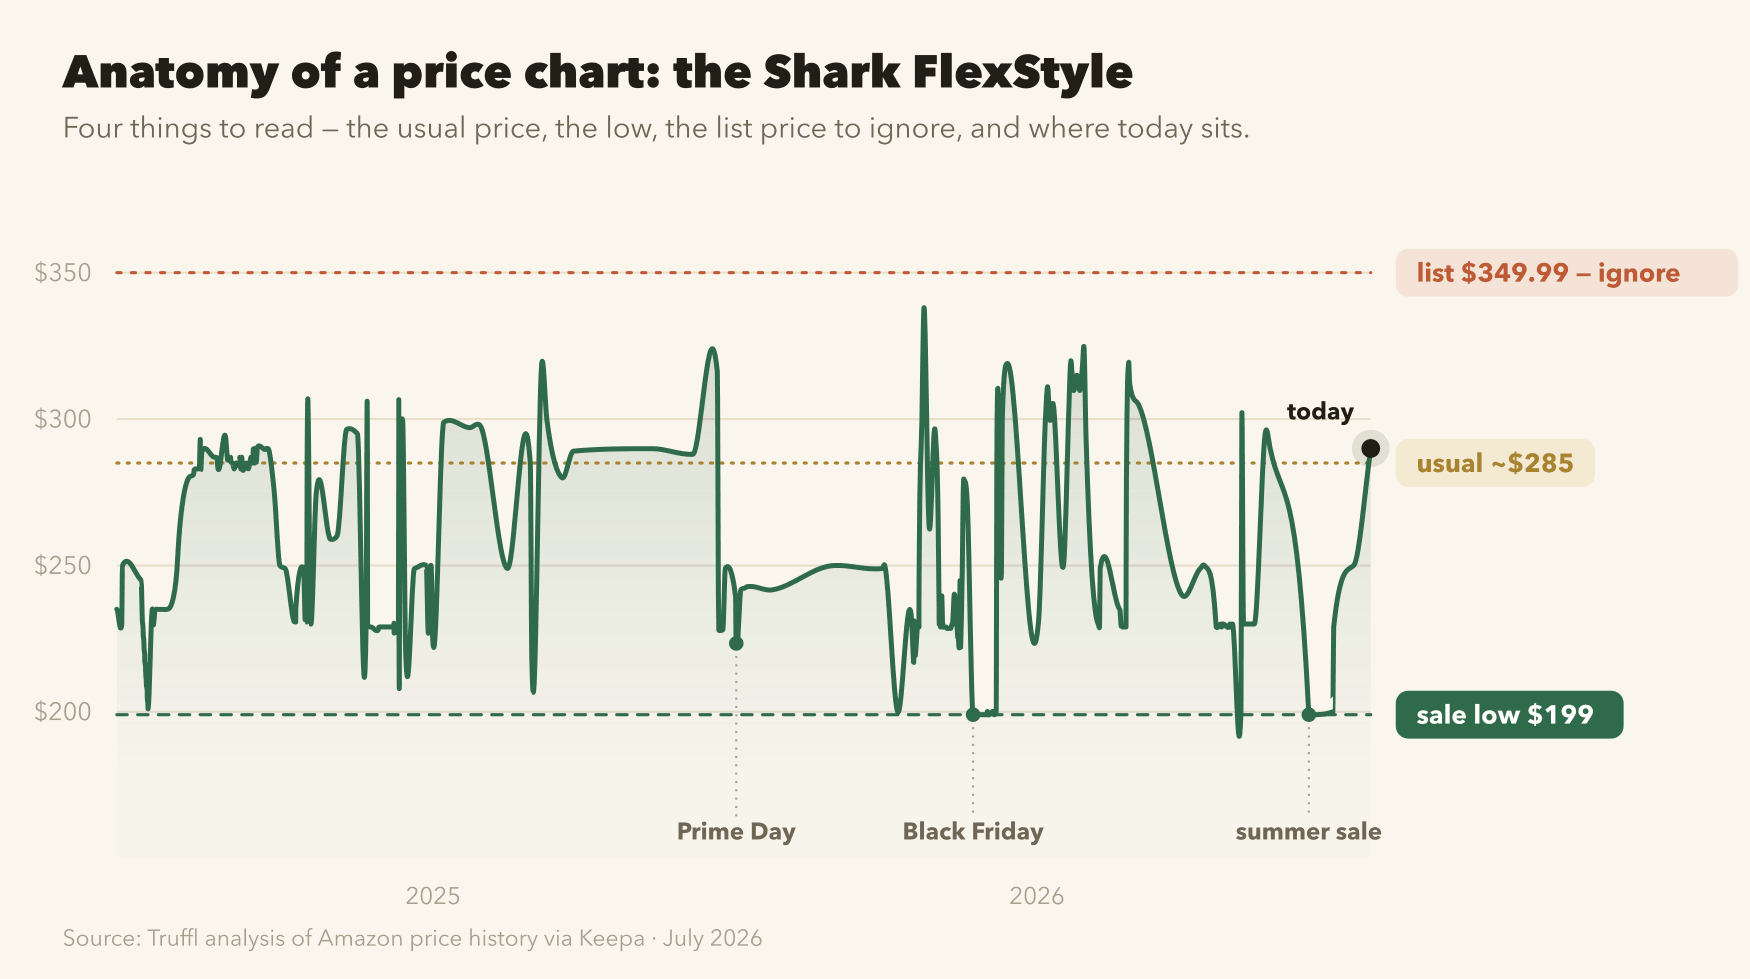
The same chart, four ways to read it. Source: Truffl analysis of Amazon price history via Keepa, July 2026.
That's the Shark FlexStyle — a popular $300-ish hair tool — over the past two years. Once you can read it, you can read any of them. Here are the four things it's telling you.
1. The usual price — the line's center of gravity
Start by finding where the price spends most of its time. On the FlexStyle that's about $285 (the gold line). This is the honest "normal" — not a marketing number, just what the thing actually costs most weeks. It's the benchmark every discount should be measured against. So the first question is simple: is today's price below $285, or not? If it isn't, there's no deal, whatever the badge says.
2. The low — how cheap it actually gets
Next, find the floor. The FlexStyle drops to $199 (the green line) — $86 below its usual price and $150 below its list price. The low is the number that tells you how much is on the table. A "sale" that isn't near the low isn't much of a sale. You don't need the price to hit the exact floor every time, but knowing it exists reframes everything: at $290, you're paying nearly a hundred dollars more than this product is willing to sell for.
3. The pattern — when the lows happen
Now look at when the price touches that floor. On the FlexStyle the dips aren't random — they land on the year's big sale events, and you can see them marked on the chart: Prime Day, Black Friday, and the summer sales in between (October's Big Deal Days is another reliable one). A product with a clear rhythm like this tells you not just whether to buy, but what to wait for. If today isn't a low and the next sale event is weeks away, that's your answer.
4. The list price — ignore it
There's almost always a line at the very top: the "list price." On the FlexStyle it's $349.99 (the terracotta line) — a level the real price barely ever reaches. It's the ceiling, not the signal. A discount measured from it tells you nothing: sometimes it's a genuine but outdated MSRP, sometimes it's pure fiction. Our guide on how to spot a fake Amazon discount breaks down the three ways that number lies. For reading a chart, the rule is short: don't look at the list price. Look at the usual price and the low.
5. Putting it together — is now a good time?
With those four in hand, the whole chart answers one question. Today the FlexStyle is $289.99 — right at its usual $285, and $90 above its $199 sale low. So it's a perfectly ordinary price, not a deal. The read: don't buy today; wait for the next sale event, when it's usually fallen back toward $199. Which is exactly what Truffl's read on the FlexStyle says: wait.
The ten-second version
You don't have to study the whole chart every time. Once you've found the usual price and the low, there's a single question: where does today's price sit between them? Near the low → buy. At or above the usual → wait, and check whether a sale event is coming. That's the entire skill.
And you don't have to do it by hand. Paste any product into Truffl and it reads the chart for you — the usual price, the low, the pattern, and whether now is actually a good time. Check a price →
We may earn a small commission if you buy through our links — it never changes the call.